2017
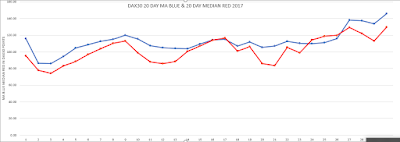
PLOT OF DAX30 RANGES 20 DAY MA [BLUE[ VS 20 DAY MEDIAN [RED] [Click on chart to enlarge]
Directly
above is a line chart, from the start of 2017 to present, that shows the
average 20 day simple MA [moving average] in blue, versus the average 20 day
simple MEDIAN in red for the following week in the DAX30. The blue line is the “simple
average” of the last 20 days ranges for each day; the red line is the MEDIAN
[meaning the 50% value of 10 days above and 10 days below] of the last 20 days
ranges.
When
the BLUE LINE IS OVER THE RED LINE, it means there are some outlier large
ranges [up/down doesn’t matter] in the last 20 days that were well above
average for the series, and tends to skew the data higher. WHEN THE BLUE LINE
IS UNDER THE RED LINE, it means there were some abnormally “low range” days
that skewed the data for the series lower. And finally, when both lines are
relatively equal, the data is consistent for the last 20 days and most days
fall relatively close to the average and median; in other words, no outlier
days.
What
this gives you is a very good “snapshot” of intraday volatility in the DAX30,
and whether it is increasing, going down, or relatively stable in terms of expected
ranges each week. You can tell from the above graph, for example, that at the
start of the year intraday volatility dropped, as that data is dependent on
data from December and the Holiday’s, where ranges can be very low. In
addition, we also had a drop during the period surrounding the Dutch and French
elections, as uncertainty gripped Europe and stock traders and investors backed
away. You can also see, that right now we are at the highest levels of intraday
volatility of 2017.
From
now on, on Sunday, I’ll post the chart for the UPCOMING WEEK, and give the raw
data for the year in table form directly below it, so you can see the actual
values for each week of the year. For each date and corresponding value, it
means for example, that for the upcoming week of July 24th that
starts Monday [tomorrow], you would use either or both of the values in your
trading for each day of this week. Next weekend, I’ll post a new chart with new
values for that upcoming week. Directly below the tables of the raw data for
the DAX30.
[CONTINUED]
The
complete “-vegas Version 4 Volatility Algorithm” is a long document, and it’s
taking me longer than I had originally anticipated to finish it. Once I started
writing it, I quickly realized that “what I know” isn’t what you or trading
Newbies know, and that I had to make a greater effort to explain things in
simple English, along with more examples than ever before. Therefore, it’s
taking me some time, and it looks as though it may be a few weeks yet before I’m
happy with it and it’s released here on the website.
I’ve
decided, that what’s needed is a “quick guide” to the version 4 algo, and to
that end, next weekend I’ll have a very brief summary available for viewing
online or download [Over in the “Download Links” section in the right hand
column], that is only a few pages long yet gives a summary of the algorithm
rules, how to apply them and trade the DAX30 and/or the Dow30. This will get
all of you going, as well as give me some time to finish the big enchilada without
worrying about time constraints or rushing to finish and forgetting something.
Have
a great rest of your weekend everybody!
-vegas
OUR TURNKEY FOREX “PAMM/MAM” IS NOW
OPEN AND OPERATIONAL; SEE “PAMM/MAM MANAGED MONEY PROGRAM” IN “DOWNLOAD LINKS”
SECTION IN RIGHT HAND COLUMN FOR DETAILS [VIEW ONLINE AND/OR DOWNLOAD] AND
START YOUR JOURNEY FROM WHERE YOU ARE AT TO “ESCAPE
TO SUCCESS”!


No comments:
Post a Comment